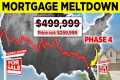
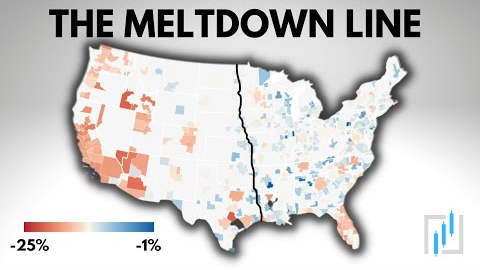
This Bizarre Line Explains The Upcoming Housing CRASH
534,096 View

- Publish Date:
- February 25, 2023
- Category:
- Real Estate Trends
- Video License
- Standard License
- Imported From:
- Youtube
My Twitter
https://twitter.com/LorenzoBatarilo
Lance Lambert Twitter (source of Nationwide housing graph)
https://twitter.com/NewsLambert
Reventure Consulting: Source of “Hidden Crash Graph)
https://www.youtube.com/channel/UCVTQunGrE3p7Oq8Owao5y_Q
Realtor.com Data
https://www.realtor.com/research/data/
Case Schiller Index YoY Change
https://fred.stlouisfed.org/series/CSUSHPINSA#0
For 41 straight months, housing prices in the United States went up. During this incredible run that started shortly before the events of 2020, the situation for buyers quickly became a nightmare. At every point where it was believed that prices were simply too high, the market punished shoppers and rewarded speculators. From Feb 2019 to June 2022, prices on the national level according to the Case-Shiller index jumped 51%. This massive never before seen leap in values changed everything we know about real estate. In some cities like Seattle for example the situation was even worse. There, values in that same time frame jump over 100%. This era of incredible growth, greed, and speculation caused millions of Americans to begin questioning the health of the market. Were we seeing the development of another super bubble similar to what we saw in the early 2000s? And was this evidence that soon another crash is on the horizon?
Did you miss our previous article...
https://trendinginrealestate.com/real-estate-trends/heres-what-you-need-to-know-when-buying-toronto-real-estate-in-2023